- ETF Focus
- Posts
- VIG, VYM Or Both? Assessing Vanguard's Dividend ETFs
VIG, VYM Or Both? Assessing Vanguard's Dividend ETFs
Investors like to own them together, but they're not nearly as different as you might think.
David Dierking
October 17, 2024 • Estimated Reading Time: 11 minutes
Sponsored by
What do Nvidia and Amazon have in common?

This is a paid advertisement for Miso Robotics’ Regulation A offering. Please read the offering circular at invest.misorobotics.com.
Well, other than trillion-dollar market caps. Both Nvidia and Amazon chose to collaborate with Miso. Miso’s the leader in AI-powered kitchen robots. That’s why Nvidia offered Miso its premier AI vision tech, and Amazon handpicked Miso to partner and use its RoboMaker simulation environment. Now, Miso launched their first commercial AI-powered robot, and it sold out in seven days. On the back of that success, they’re focused on scaling to 170+ US fast food brands in need.
For many ETF investors, the core of their dividend portfolios may include either the Vanguard Dividend Appreciation ETF (VIG), the Vanguard High Dividend Yield ETF (VYM) or both. It’s understandable why. They’re both huge, they’re cheap, they carry the Vanguard name and they have some fairly solid track records.
With one targeting long-term dividend growers and the other targeting high yielders, they would also seem to be the perfect complements to each other. That last part may not necessarily be true, but that hasn’t stopped a lot of people from owning both of them in their portfolios.
To understand exactly why requires a deeper dive into these two dividend ETFs. Despite their popularity, they do have some holes in their strategies that shouldn’t be overlooked.
Now that the Fed has started cutting interest rates and it looks like they might actually pull off the soft landing after all, it’s a good time to revisit these two funds. Not just what they are and how they’re constructed, but how well they’re set up for the current economic environment.
VYM: The High Dividend ETF

In truth, I’ve never been a huge fan of VYM. Its investment strategy is to calculate the forecasted dividend yield for every stock within its starting universe, take every stock within the top half and weight them by market cap. It’s not robust, it’s not selective and I’d argue quickly that cap-weighting a high yield portfolio isn’t the way to do it.
But it does generate a diversified portfolio that produces a yield about double that of the S&P 500. If you’re looking for a gentle step into high dividend yield stock investing, this is probably one of the better ways to do it. I still think there are funds that do a better job of targeting that I’d prefer here though.
VYM’s portfolio seriously underweights tech (12% vs. 31% for the S&P 500) and overweights several cyclical and defensive sectors in its place, such as consumer staples, utilities, financials, energy and industrials. Given how well tech performed earlier in 2024, that’s created a bit of a performance gap, but it’s performed much better over the past several months.
VIG: The Dividend Growth ETF

I like VIG’s strategy much better. It’s sort of the classic dividend growth methodology, but because requires only 10 consecutive years of dividend growth to qualify, the portfolio looks much different than that of the ProShares S&P 500 Dividend Aristocrats ETF (NOBL). Whereas NOBL tilts more defensively towards bigger, durable names, VIG is able to include “growthier” emerging dividend payers, particularly those from the tech sector. NOBL has just 3% of its assets investing in tech, but VIG is all the way up at 23%.
Given how the market has favored growth and tech over the past couple years, that’s given VIG a significant performance advantage. It won’t be that way forever, but in cases where the bulls are running, it’s reasonable to expect that VIG will outperform other dividend growth strategies.
Note: I previously wrote about some of the best Vanguard ETFs for retirement, which you can check out HERE.
VIG vs. VYM vs. VOO: Historical Performance
While these two ETFs target different segments of the dividend stock market, they’re both still targeting dividend payers. That means their performance will still be highly correlated and they’ll likely underperform or outperform the S&P 500 together.
If you go back to the launches of these two funds and the WisdomTree U.S. Total Dividend ETF (DTD), which I use as my benchmark for the broader dividend stock universe, we see that VIG has meaningfully outperformed the other two, while VYM has largely matched the performance of DTD.

I think we’re looking at tech exposure as a big reason for the gap between VIG and VYM. VIG falls into Morningstar’s Large Cap Value style box, but it’s not too far from the Large Cap Blend box, meaning it could be considered to have a more balanced approach.
VYM, on the other hand, leans way far over on the Large Cap Value side of the style box. I probably don’t need to tell you that value has largely been out of favor since we came out of the financial crisis and is still struggling to pick up any sustainable momentum, so underperformance isn’t at all surprising.
I mentioned earlier that VIG has about a 23% allocation to tech currently and that number has been slowly creeping higher in recent years as names, such as Apple and Microsoft, qualify for the portfolio. VYM’s tech allocation usually hovers in the high single digits, meaning that it’s missed out on a lot of the post-pandemic mega-cap tech boom.
In recent years, performance has balanced out with the two ETFs producing similar performance. Not surprisingly, these funds have all significantly trailed the S&P 500 thanks to investors’ overwhelming preference for growth stocks over the past several years.
VIG vs. VYM vs. VOO: Factor Analysis
Here’s where we start to see some differentiation. If we examine the factor loadings, we see some of the tilts and how different conditions can affect the funds.
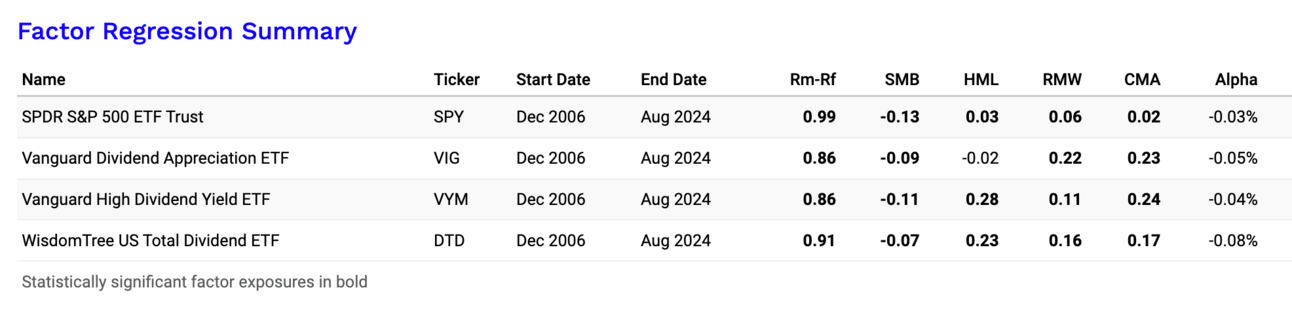
The S&P 500, of course, has very little tilt in any direction because, well, it’s using large-cap stocks as its measuring stick.
Small company factor (SMB) - VIG, VYM and DTD have only minor negative tilts towards small-caps, which isn’t at all surprising.
Value factor (HML) - As mentioned earlier, VYM has a strong value tilt, but so does the dividend stock universe in general, which I find a little surprising. VIG is pretty much right down the middle, suggesting a nice balance between growth & value. Again, that could be due to the relative overexposure to the tech sector.
Profitability factor (RMW) - All three dividend ETFs are over-exposed to more profitable companies, which isn’t surprising given that companies generally have to be in a good financial position to pay and grow their dividends over time. High yielders tend to be, as a whole, more economically-sensitive and that can affect their balance sheet health.
Conservative investment factor (CMA) - All three dividend ETFs score highly on this front and score significant advantages over the S&P 500.
The only significant factor difference between VYM and VIG is the value factor. In other words, if we see quality or defensive stocks outperforming, we’re unlikely to see major performance differences between the two. When value or growth is significantly outperforming, however, that’s when we could see performance gaps, as we did in 2020-2021.
VIG vs. VYM vs. VOO: Portfolio Composition
The analysis gets a little more complicated when we consider the composition of the portfolios.
On the surface, you’d expect to see some, but not a great deal, of overlap. After all, they’re both dividend portfolios. We’ve also seen that VIG has a noticeably higher weight in tech, while VYM and its value tilt tend to favor cyclicals.
The overlap between the two funds, however, is startlingly high.

VIG and VYM have a 59% overlap, which is very high even by dividend ETF standards. I start to get cautious about pairing funds when the overlap hits the 40% mark because diversification benefits start getting more minimal at that point. When the overlap approaches 60%, you have to ask how much benefit there actually is to pairing them. The correlation will, in many cases, be quite high and mitigate the risk-reducing benefits of owning them together.
There are the sector allocation differences that we discussed earlier and that will give VIG and VYM some different risk/return profiles. But these funds aren’t nearly as dissimilar as you’d think.
VIG vs. VYM vs. VOO: How They Fit In Your Portfolio
Historical performance suggests there is some benefit to owning both VIG and VYM when growth or value is a noticeable outperformer. VIG’s tilt towards growth & tech also has the potential of balancing out some of VYM’s value and cyclical heavy exposures.
But in the majority of market conditions, I’m not sure there’s going to be much benefit to owning them together. With the exception of the 2019-2021 time frame, there was little performance difference between the two funds.
Given that the periods when growth or value are leading does tend to produce some very different returns, I’d favor owning both of them together. You’ll obviously be moderating your performance in these situations, but the risk-balancing and avoiding the “feast or famine” outcome is probably more beneficial.
Both VIG and VYM, however, are still solid funds individually. They’re cheap and do the job they set out to accomplish even though their selection criteria are a little loose and bland. For investors simply looking for exposure to these strategies, there are certainly worse options out there.
Reply