- ETF Focus
- Posts
- Mid-Year Dividend ETF Review: Which Funds Have Killed It & Which Have Struggled?
Mid-Year Dividend ETF Review: Which Funds Have Killed It & Which Have Struggled?
A few under-the-radar dividend ETFs have actually delivered some impressive risk-adjusted returns so far in 2024.
David Dierking
June 13, 2024 • Estimated Reading Time: 6 minutes
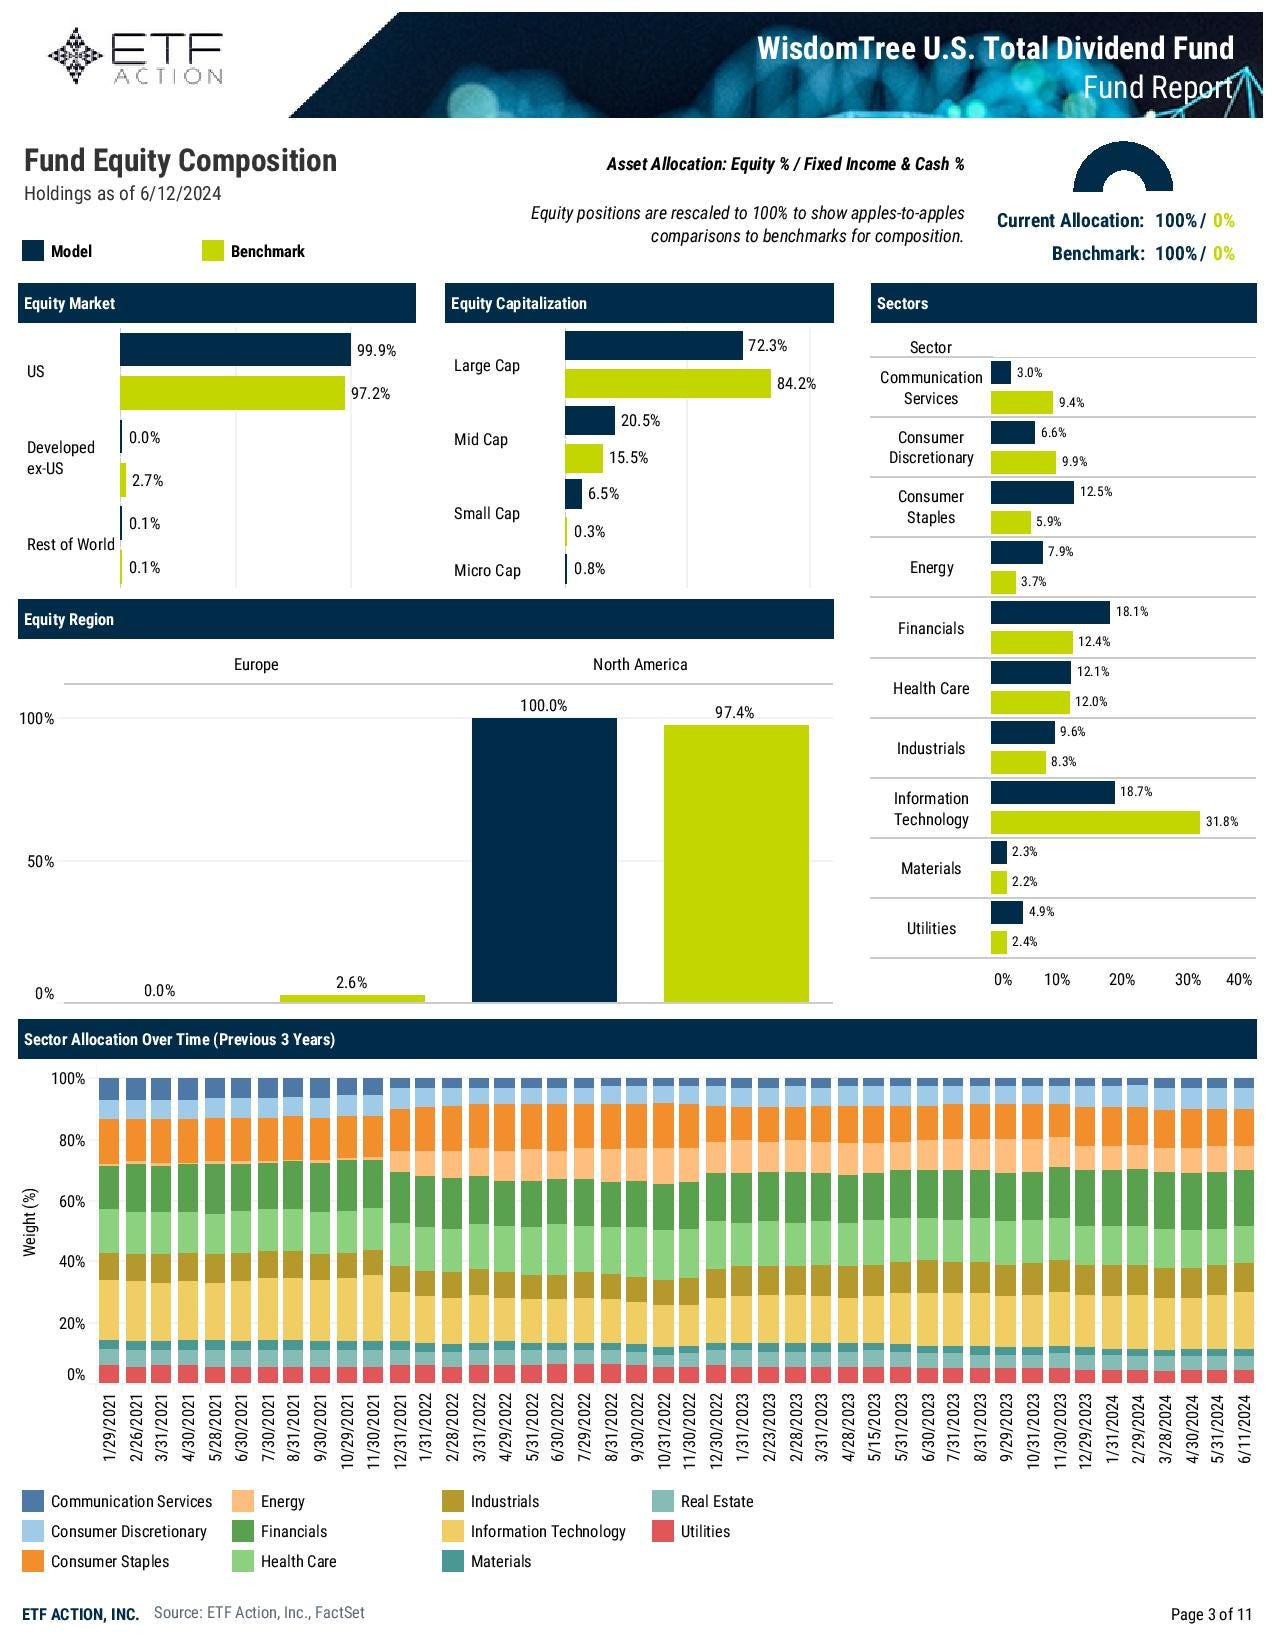
Overall, it hasn’t been a very good year for dividend stocks. While the 9% return of the WisdomTree U.S. Total Dividend ETF (DTD) during the first half of a calendar is strong by most measures, it’s not nearly as positive when the S&P 500 has gained 14% and the Nasdaq 100 has returned 17%. In fact, just one dividend ETF, the AB U.S. High Dividend ETF (HIDV) has managed to beat the S&P 500 this year.
While absolute returns have lagged, risk-adjusted returns actually haven’t been that bad at all. That simply means that dividend ETFs have (very broadly) delivered around the same level of return per unit of risk taken. Since dividend stocks are generally more conservative than the rest of the market, that means they’re trailing in the current bull rally, but they are, however, still doing roughly what would be expected of them.
According to the Sharpe ratio, one popular measure of risk-adjusted returns, the S&P 500 is beating DTD over the past year by a 1.64 to 1.50 margin, but according to the Sortino ratio, another risk-adjusted return measure relative to downside risk, DTD is winning 5.71 to 4.87. So while dividend ETFs haven’t performed at the level of the major averages, they’ve still served as a very important piece to diversified portfolios.
Of course, some have performed better than others, while others have done worse. To determine which funds fall into which bucket, I want to look not just at the absolute year-to-date return, but the risk-adjusted returns as well. Some ETFs generate fabulous returns, but if they’re taking enormous risks to achieve those returns, those great returns can look relatively average pretty quickly. HIDV, for example, may be the best-performing dividend ETF year-to-date, but its Sortino ratio is actually worse than DTD’s. That means the fund’s risk/reward profile isn’t quite as its returns make it seem.
Let’s start first by setting a benchmark, using DTD as our proxy.
WisdomTree U.S. Total Dividend ETF (DTD)
Index: WisdomTree Dividend Index
Expense Ratio: 0.28%
Year-to-Date Return: 8.1%
Sharpe Ratio: 1.50
Sortino Ratio: 5.71
source: ETF Action
I detailed the numbers already above in terms of returns and the pair of risk-adjusted metrics.
To determine which ETFs fall into the “have done well” category, I’m looking at all three numbers together. I want to see funds that have outperformed on both an absolute and risk-adjusted basis because that’s where the real alpha is achieved. Conversely, funds that lag on all three of those measures will fall into the “struggled” category.
I’m going to pick three ETFs in each category and offer my thoughts on why they have or have not had success so far in 2024.
ETFs That Have Done Well In 2024
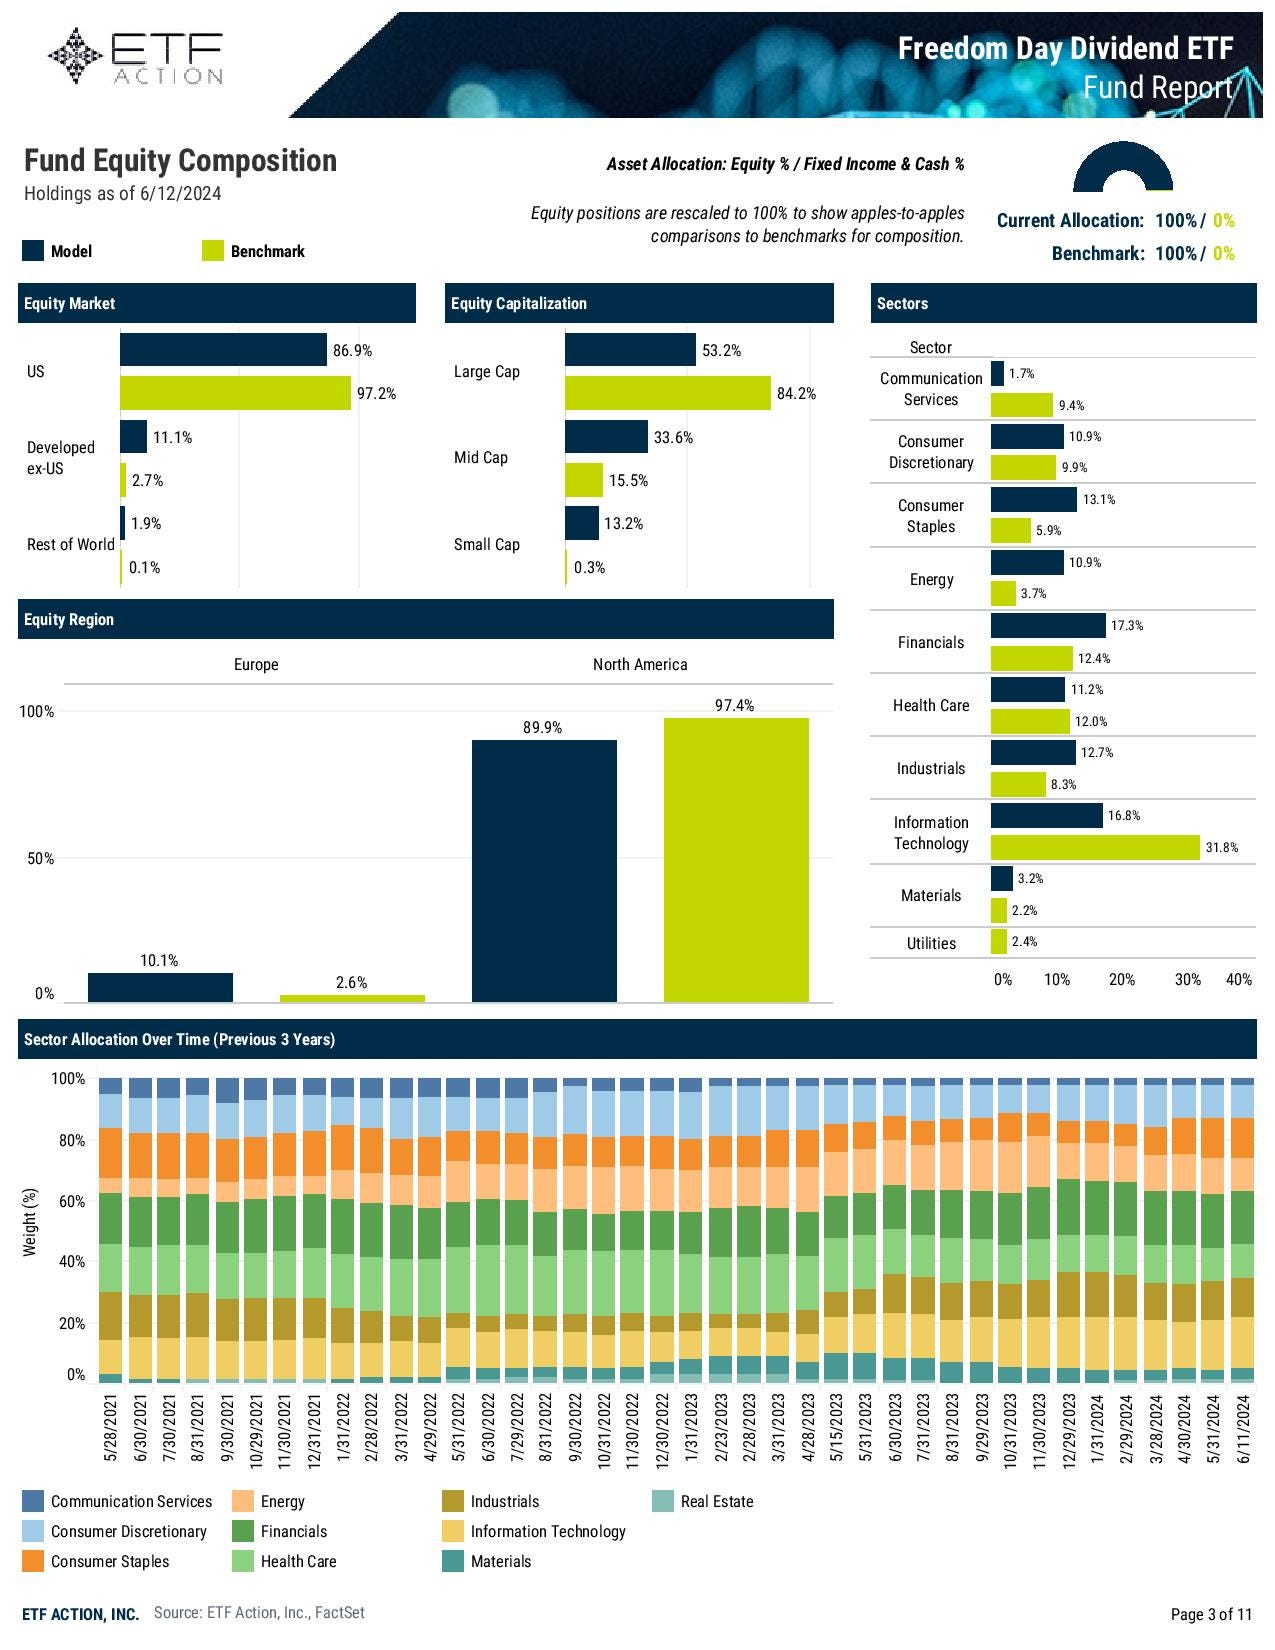
Freedom Day Dividend ETF (MBOX)
Index: none/active
Expense Ratio: 0.39%
Year-to-Date Return: 10.6%
Sharpe Ratio: 2.05
Sortino Ratio: 9.72
source: ETF Action
Quite simply, there hasn’t been a better combination of absolute and risk-adjusted returns within the dividend ETF category in 2024 than what MBOX has been able to produce. Yet this fund still remains remarkably under the radar, having just crossed the $100 million mark recently after three years in business.
MBOX’s returns are even more remarkable considering that the portfolio is underweight U.S. stocks, U.S. large-caps and tech; the three areas of the market that have performed particularly well this year. Since the fund is actively-managed, the team has really excelled at security selection. According to the fund’s prospectus:
“The sub-adviser strives to identify dividend-paying companies with the potential for increasing dividend payments in the future. The sub-adviser first analyzes securities using a fundamental analysis, which seeks to measure the security’s intrinsic value as measured by price multiples, earnings ratios, and other measures of value relative to the price of the security. Thereafter, the sub-adviser uses quantitative metrics to seek to identify dividend-paying companies that have potential for multiple dividend increases over time. The sub-adviser will assess company metrics, such as dividend payment history, free cash flow, dividend growth rate, and other technical factors to assess the likelihood of a candidate company’s ability to provide ongoing, and increasing, dividend payments. The fund is generally expected to hold securities of approximately 30 to 50 companies at any given time.”
Quality & dividend growth are key components in the fund’s strategy and it’s been able to deliver, even if the dividend yield isn’t particularly high.
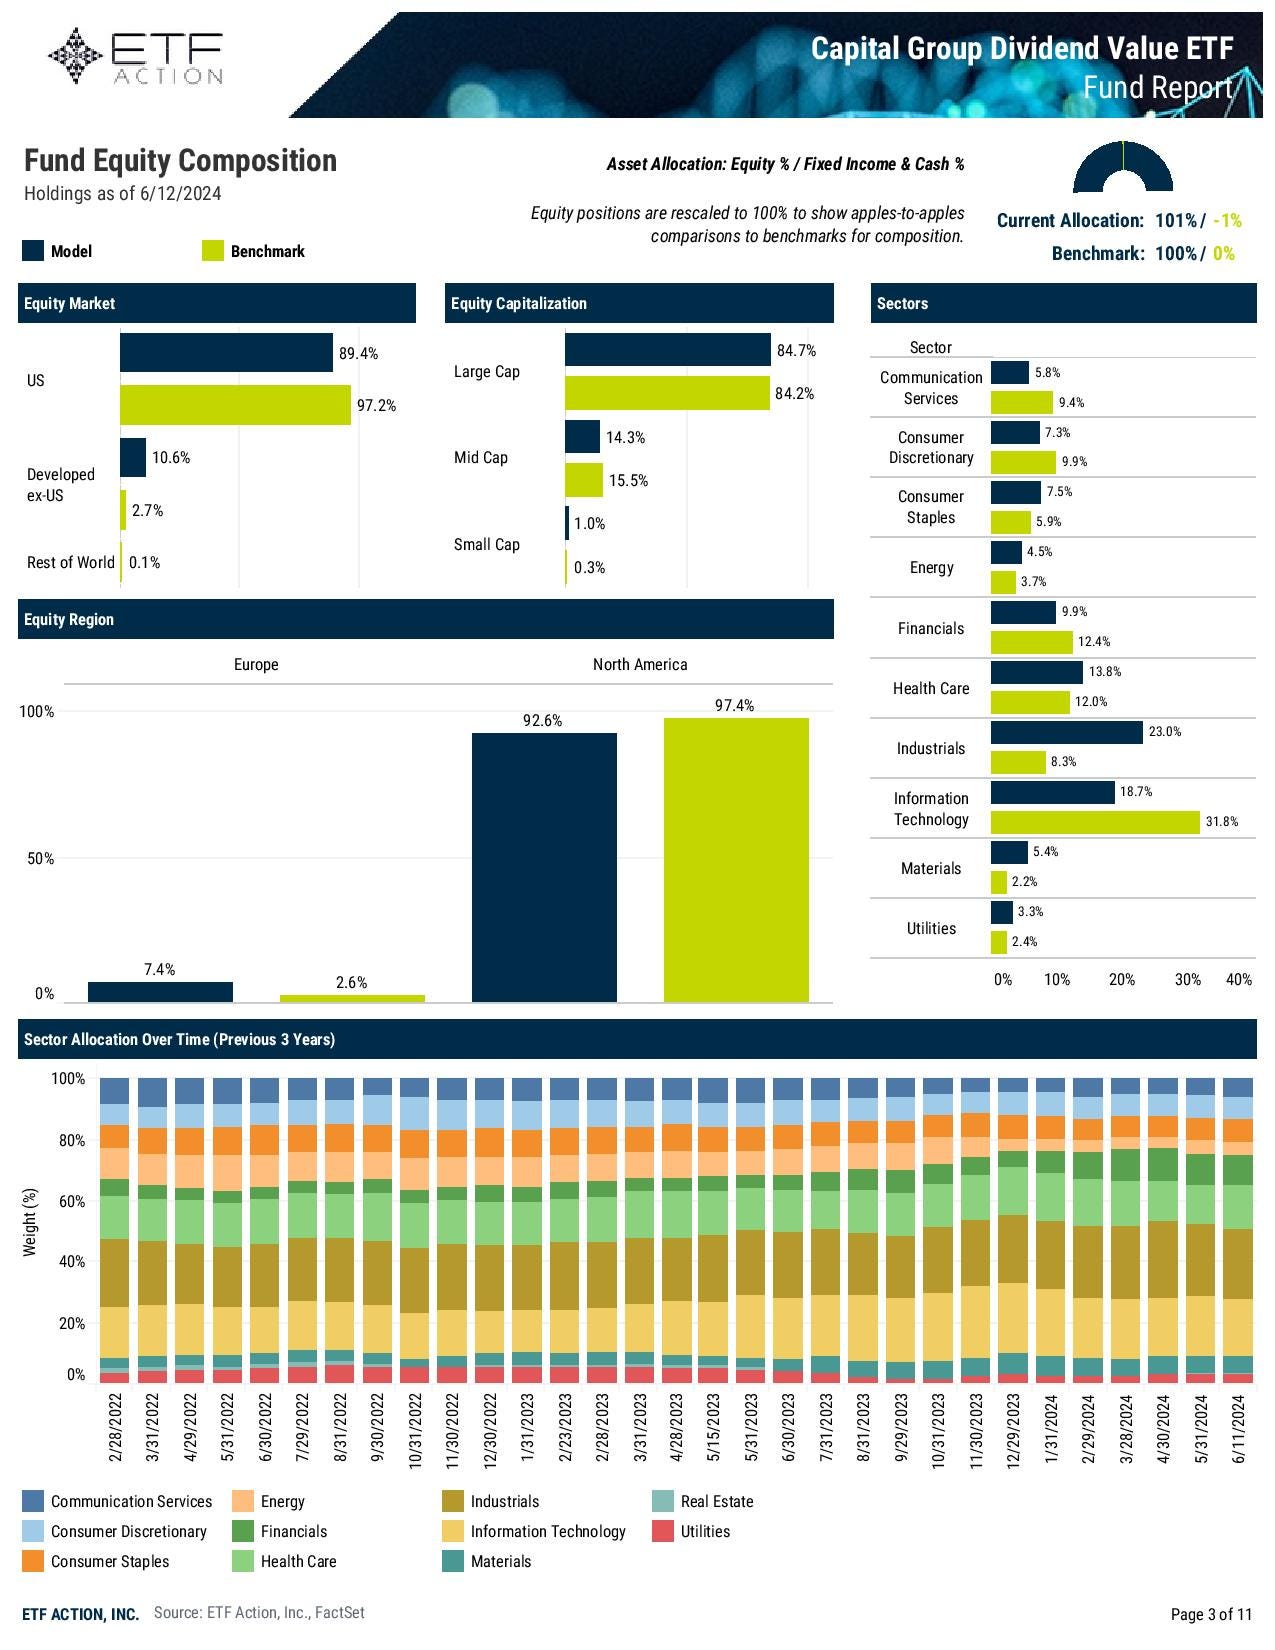
Capital Group Dividend Value ETF (CGDV)
Index: none/active
Expense Ratio: 0.33%
Year-to-Date Return: 10.7%
Sharpe Ratio: 1.94
Sortino Ratio: 9.32
source: ETF Action
CGDV is the other dividend ETF, along with MBOX, that has put itself on a tier above the others this year. I’ve gone on record already talking about how I’m not a huge fan of this fund because of its mandate that allows for the inclusion of stocks with “the potential to pay dividends” instead of solely dividend payers. That gave the fund’s managers the ability to add stocks, such as Facebook and Alphabet, to the portfolio during a period where the magnificent 7 stocks were roaring, even though they didn’t pay a dividend at all. At least those companies have actually started to pay dividends, but that also puts CGDV in the category of not quite a pure dividend stock ETF.
I will say though that those instances are relatively few. The strategy of tilting a little more towards growth and delivering an above average has clearly paid off, even though it gets a little loose with its selection criteria.
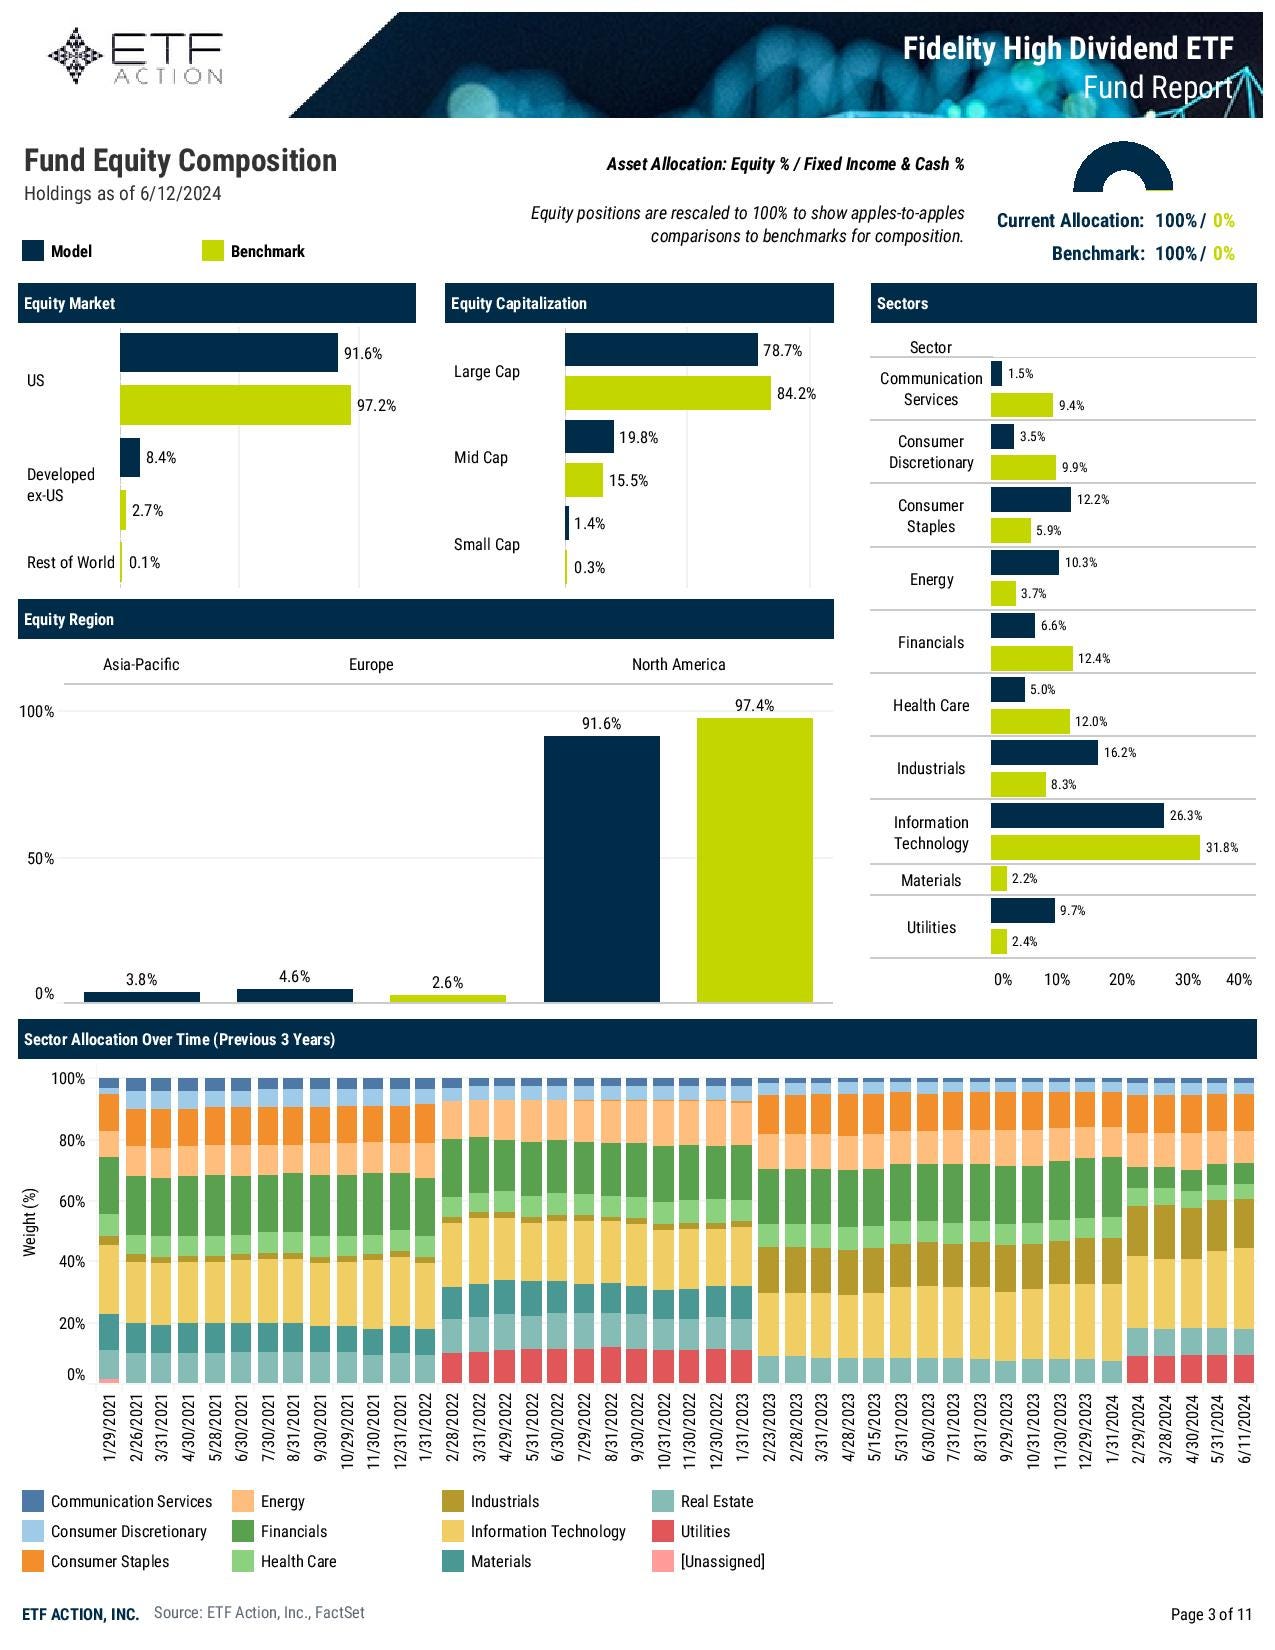
Fidelity High Dividend ETF (FDVV)
Index: Fidelity High Dividend Index
Expense Ratio: 0.15%
Year-to-Date Return: 11.7%
Sharpe Ratio: 1.78
Sortino Ratio: 6.16
source: ETF Action
Fidelity isn’t necessarily known for its handful of dividend ETFs, but that reputation should be changing. High yield ETFs have generally been more kind to shareholders in 2024, but this is a fund that has consistently performed well throughout the past several years. With the Morningstar’s Large Value category, its performance ranks in the top 2% over the past three years and in the top 6% over the past five years. In the process, it’s earned a well-deserved 5-star rating.
High yielders have the potential for being riskier than the broader dividend stock universe, but FDVV has managed to keep risk under control pretty well. Compared to DTD, it’s only about 5% more volatile and that’s likely a result of the fund’s focus on both dividend yield AND dividend growth. The latter criteria gets a little lost given the fund’s name, but it’s helped to balance out risk over time.
ETFs That Have Struggled In 2024
Index: S&P 500 Dividend Aristocrats Index
Expense Ratio: 0.35%
Year-to-Date Return: 2.7%
Sharpe Ratio: 0.24
Sortino Ratio: 0.53
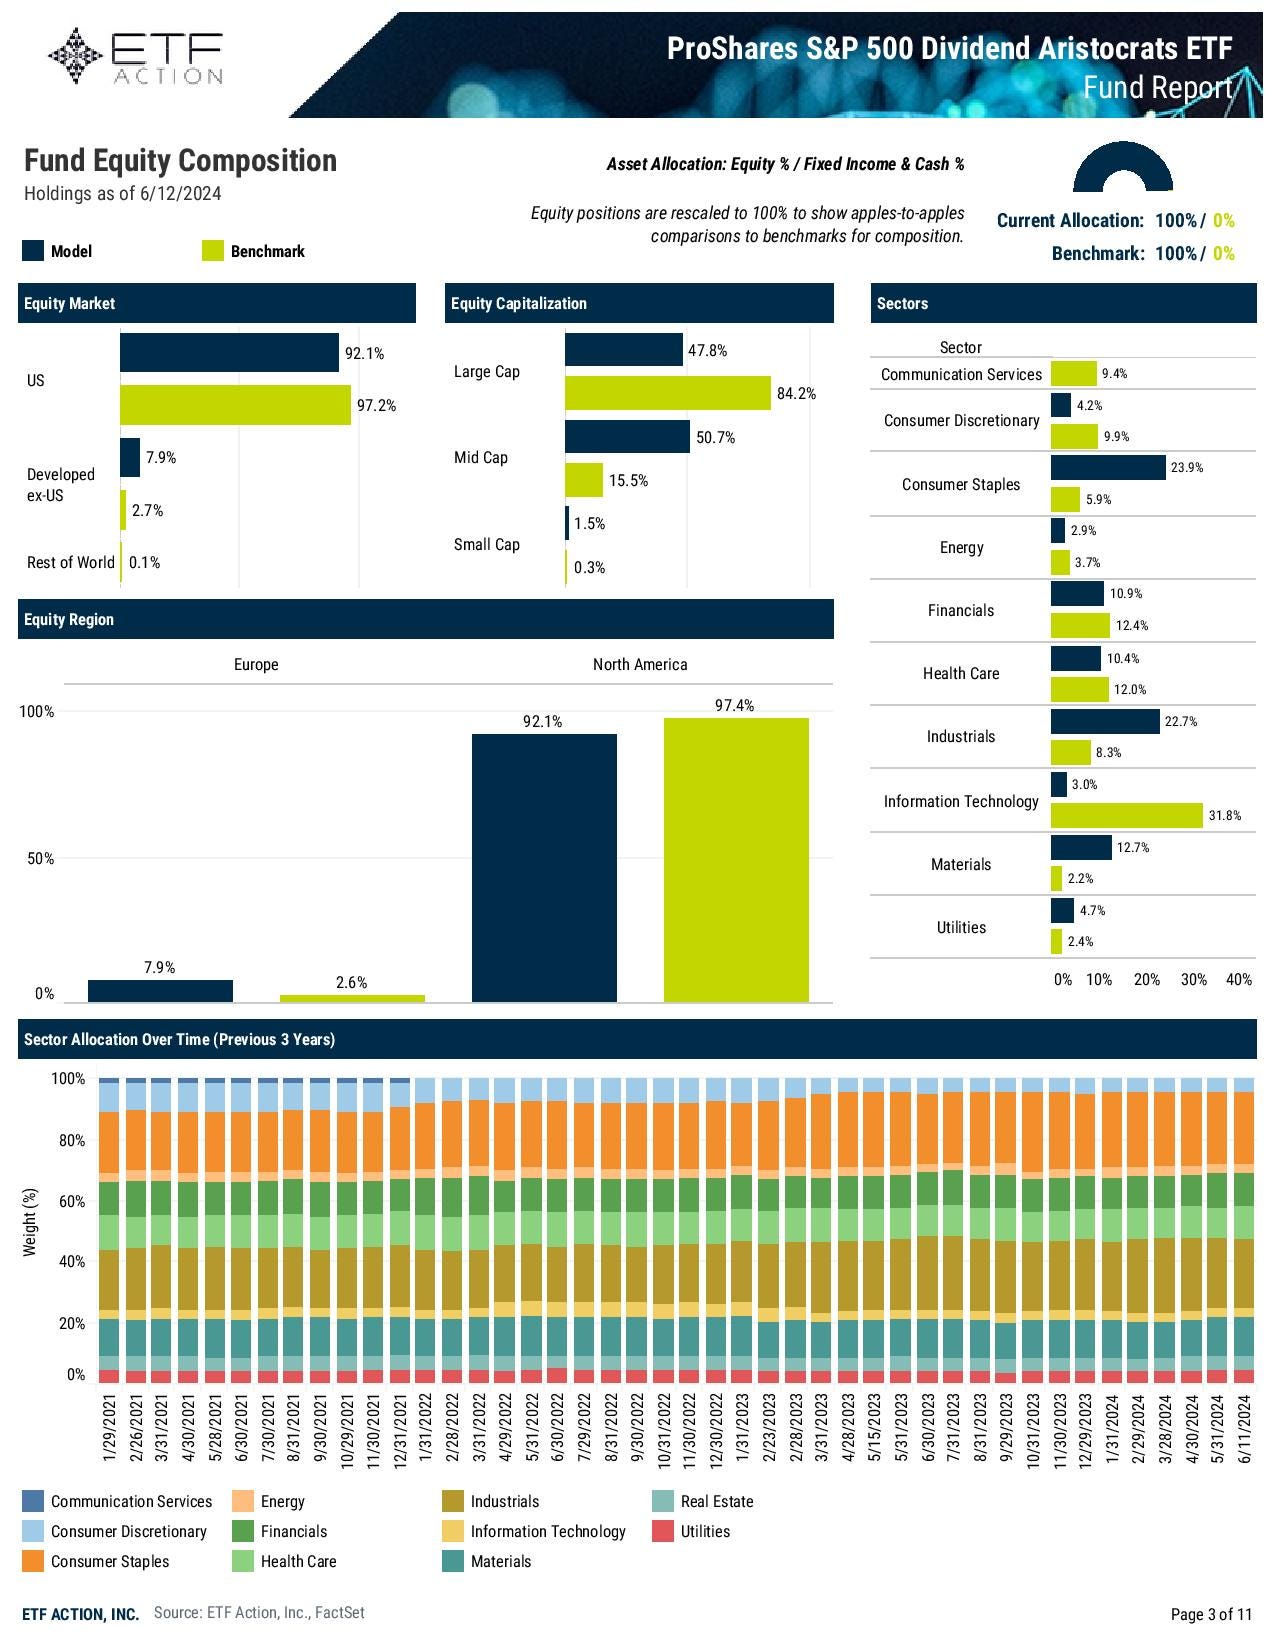
source: ETF Action
If MBOX is one of the best dividend ETFs this year, NOBL would be one of the worst. It’s a bit of a shame too because, with more than $11 billion in assets, the dividend aristocrats have been a popular landing spots for income seekers to find consistent and durable dividend growth. While it continues to deliver on that premise, it’s not at all what investors have wanted this year. NOBL has almost no exposure to tech or communication services, currently the two best performing sectors year-to-date, and its huge overweights to both industrials and consumer staples have been a big drag on performance.
While the aristocrats have never been known as high yielders, one of the plusses has been that the fund has improved its current yield to 2.3%, one of the highest levels it’s been since its inception over a decade ago.
SPDR S&P Dividend ETF (SDY)
Index: S&P High Yield Dividend Aristocrats Index
Expense Ratio: 0.35%
Year-to-Date Return: 3.9%
Sharpe Ratio: 0.24
Sortino Ratio: 0.52
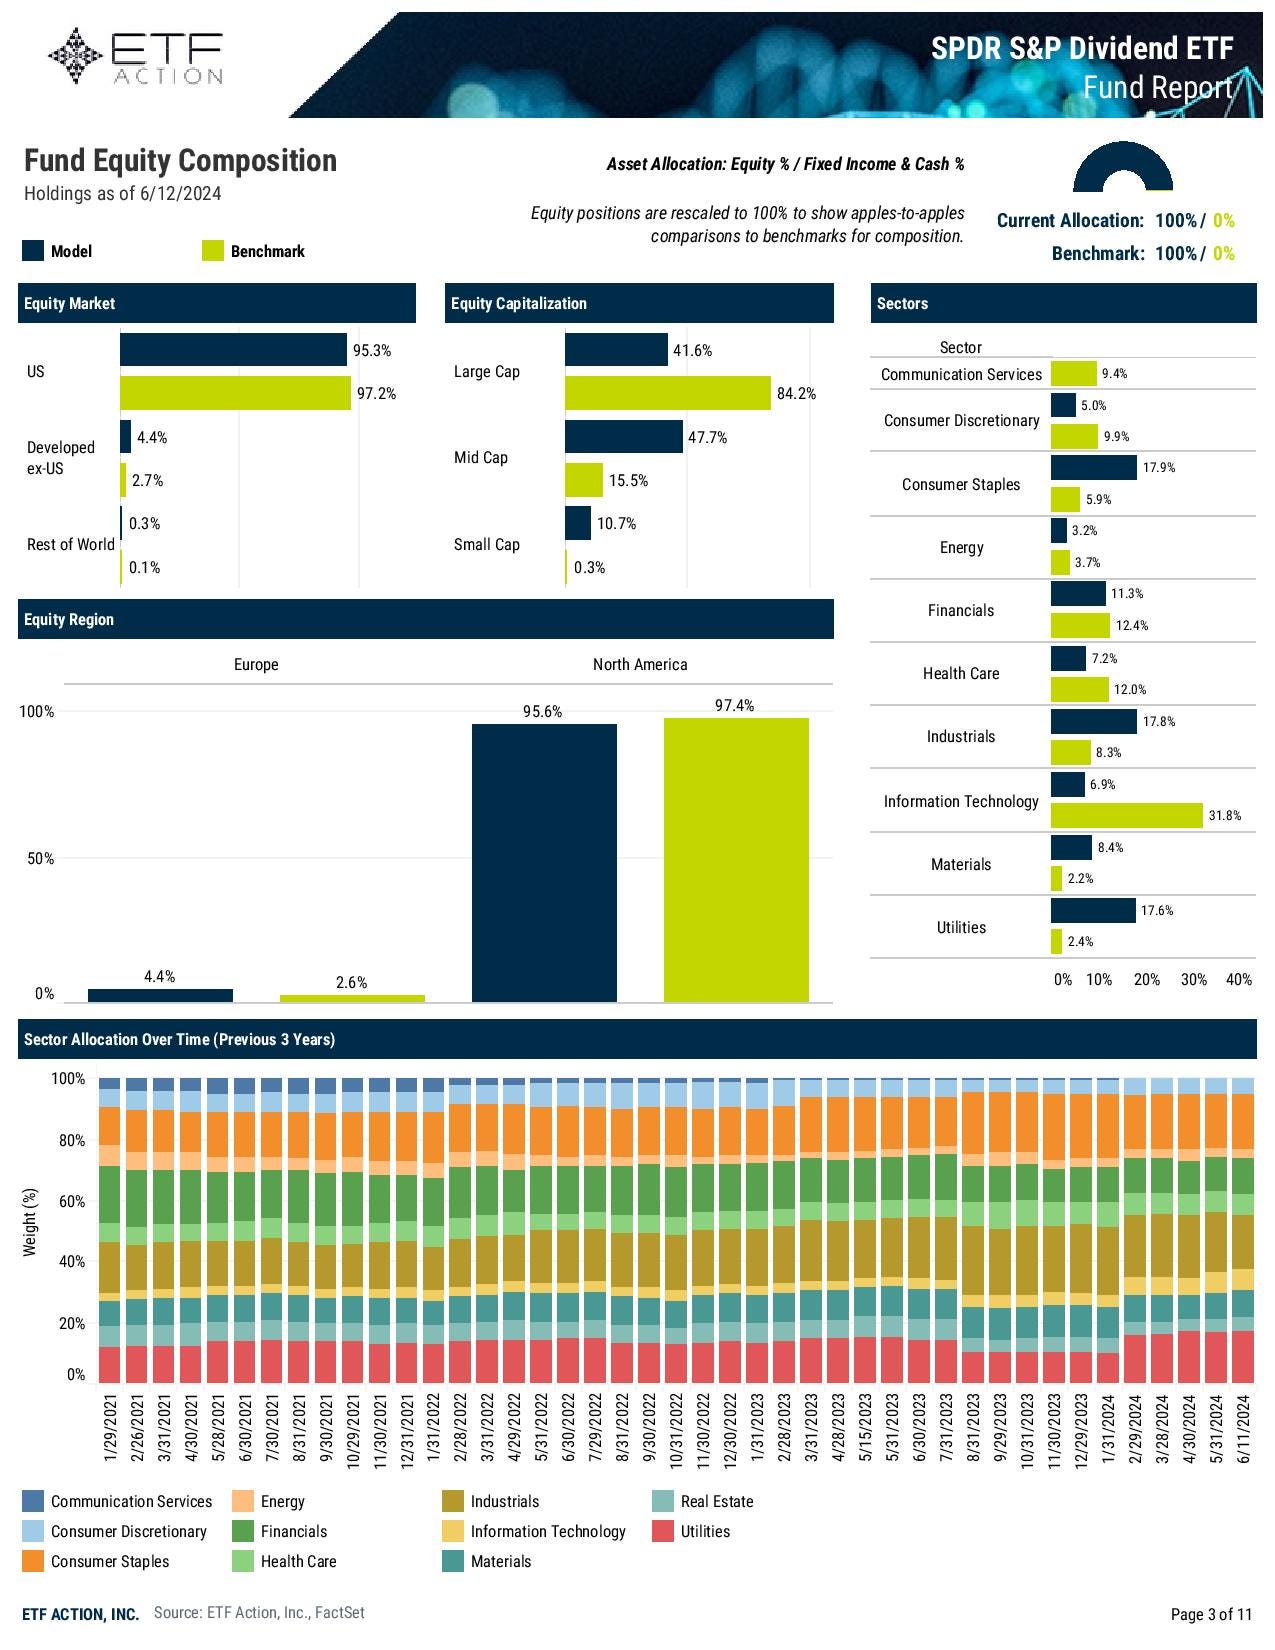
source: ETF Action
SDY, as the index’s name suggests, is essentially the high yield version of NOBL (although the dividend history requirement is a little less). Therefore, it’s probably not surprising that it has also performed quite poorly, even going so far to nearly match NOBL’s risk-adjusted performance statistics. SDY’s sector tilts have been a little less egregious, which has allowed it to generate slightly better performance, but it’s not going to be nearly enough to satisfy shareholders.
The other thing really hurting SDY at the moment is the fact that half of its holdings come from mid-caps. Mid-caps have trailed large-caps by roughly 8% year-to-date, making it incredibly difficult to generate anything near benchmark-matching performance when all factors are considered.
Index: S&P Technology Dividend Aristocrats Index
Expense Ratio: 0.45%
Year-to-Date Return: 5.1%
Sharpe Ratio: 0.44
Sortino Ratio: 0.97

source: ETF Action
This one might come as a bit of a surprise given that it’s invested in tech stocks. However, a look at the fund’s top 10 holdings might provide some clues as to why it’s struggled this year. Among the biggest weightings in the fund are IBM, Lam Research and Oracle. These are some of the old, stodgy tech names, not the new names, such as NVIDIA, that are getting investors excited at the moment. The bottom line is that investors have mostly wanted growth all throughout 2024. These companies are nearing the mature stage of their life cycles and that’s not what people are looking for at all at the moment.
Final Thoughts
In summary, here’s what we’ve been looking at in terms of the winners and losers.
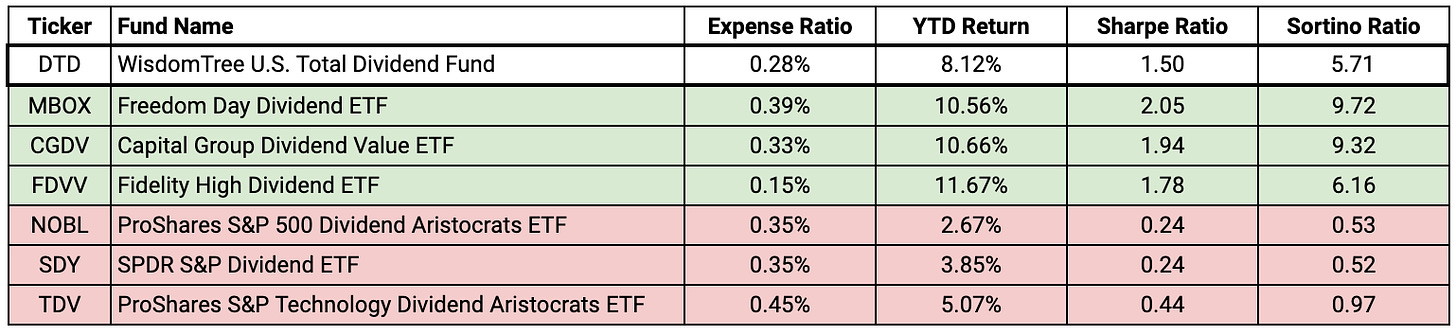
Basically, the more defensive the dividend ETF has been, the worse it’s performed. Therefore, it’s no accident that NOBL, SDY and TDV, three funds that have long-term dividend growth as a primary part of their strategy, have been among the year’s worst performers.
In general, high yield dividend stocks have performed better, but there’s been almost nothing in the way of pure winners on a performance basis. Risk-adjusted returns, however, have been very positive still in some cases. MBOX is a personal favorite of mine and may be one of the most underappreciated dividend ETFs of all.
Performance will change as market conditions change, but growth & tech are firmly in favor at the moment and that’s going to make it a trickier landscape for dividend seekers to navigate.
Reply